Save cloud costs
Step down in VM memory size using IIS application pool recycling.
Many production ASP.NET applications suffer from high memory usage in the w3wp.exe worker process, due to over-time accumulation of .NET objects in memory. This leaky memory usage is fairly common, and can be due to:
- Natural growth of caches.
- Memory leaks (long-term referencing of objects).
- Increased concurrency from occasional long running requests (each request requires response buffer space, and other application data).
This over-time memory growth causes companies to increase their VM instance sizes to the highest memory required by their application pools, to keep the server VM from running out of memory during the peak state.

Each time you increase the VM memory size, this typically increases the MINIMUM cloud hosting costs for your website by a factor of 2x.
Why do cloud costs increase 2x+ due to memory usage?
This happens because while you can HORIZONTALLY scale your web farm to more instances in response to higher traffic load, the memory usage is VERTICAL and is normally fixed for the entire farm. So, once you go from an 8Gb Standard_D2_v4 in Azure, to the next size up 16Gb Standard_D4_v4, the cost of each VM in your farm just went up from $.209/hr to $.418/hr.
Regardless of how many instances you need.
When your website has lower traffic and lower CPU utilization, you can elastically scale down your instances. However, you are forced to pay for the memory capacity at all times, whether or not you are using it, just because your application MAY eventually need it.
Why not optimize memory usage?
At LeanSentry, we see about 60% of our customer’s websites experience this type of memory leakage when they first come to us.
The question is, if this costs people money, why haven’t developers already optimized their production memory usage?
The answer lies in the fact that memory leaks usually develop under real load in production, and historically doing memory analysis in production has been very difficult.
As a result, most teams are not used to doing memory tuning, and Ops are left to throw hardware at the problem if the application “needs” more memory.
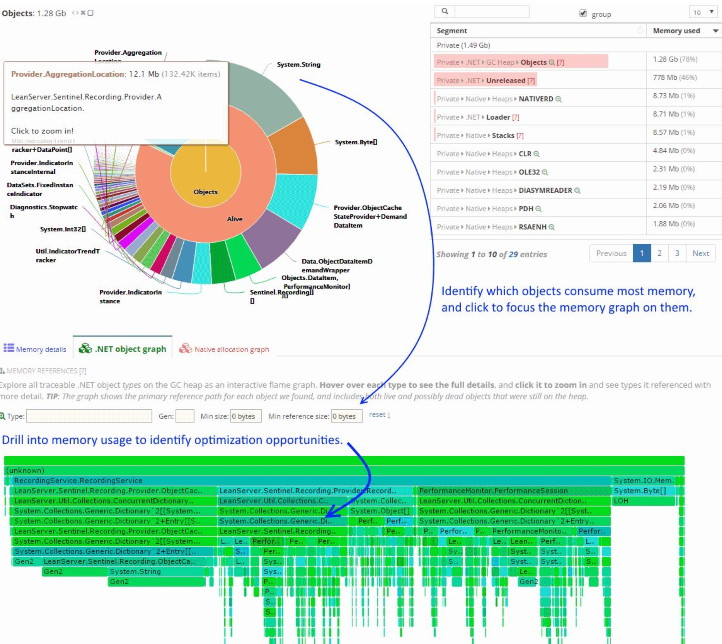
If you have LeanSentry, you can use LeanSentry Memory diagnostics offers to relatively easily optimize production memory usage of your IIS worker process. We strongly recommend doing this to both reduce costs and improve performance (by reducing GC overhead).

However, while you are working on that, you can still apply the recycling tip below to achieve short term savings.
How to reduce cloud costs by recycling
Alright, let’s get to it.
The idea here is simple. For most applications, the memory growth is gradual, not instantaneous. This means, instead of the application requiring 16Gb immediately upon load, it may start at 5Gb and slowly grow to 14Gb over the course of the day.
This means, we would likely need to allocate a 16Gb VM to host the application.

Instead, using our recycling approach, we will determine if we have a “minimum reasonable time” that we can operate the application before it reaches ~80% of the memory capacity of the VM size 1 step down from the current VM size. Then, we simply recycle the application pool once it reaches the target memory size.
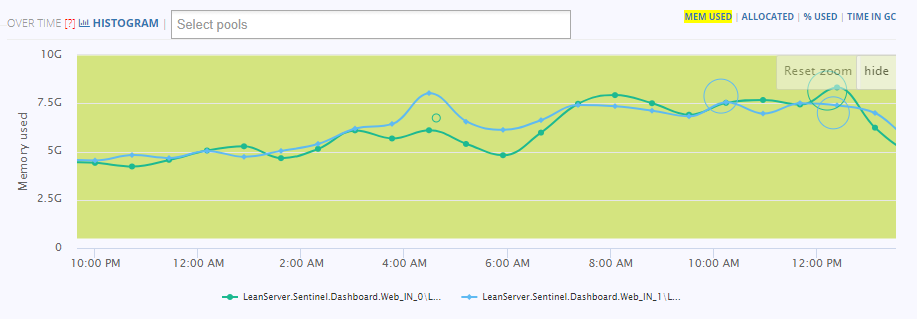
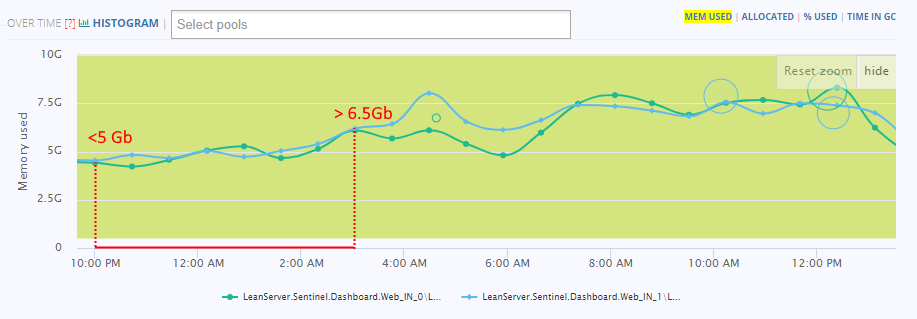
For example, our own LeanSentry dashboard for our website running on a 16Gb instance, our goal could be to fit into the 8Gb instance. For this, we need our application to stay under ~6.4Gb before we recycle it. As you can see below, we would normally take about 4 hours to grow to that size, which is an entirely reasonable amount of uptime before recycling.

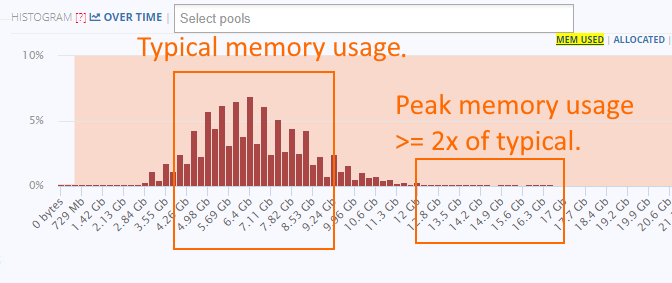
We also like to do another memory assessment using the LeanSentry histogram, which tells us the normal range of usage that our application requires most of the time.

Using this histogram, we can see that our application spends most of its time in the 4-7Gb range. However, you can also see the long tail taking us all the way to 15.5Gb. This maximum usage, which happens VERY rarely, is what currently dictates our VM size and our cost.
So, it’s both entirely reasonable to expect our application to spend most of its uptime under 6.5Gb, as well as to expect there being some good opportunities to eliminate the memory leak causing the long tail with some well placed memory diagnostics.
Implementing memory recycling
At this point, we know that:
- Our application spends most of its time below 6.5Gb, so we can put it on an 8Gb VM to reduce our costs by 2x.
- It takes more than a few hours to get there, so we don’t anticipate constant recycling churn.
This is all we needed.
Now, let’s configure the private memory (allocated memory) recycling threshold for the application pool:
| appcmd set apppool POOLNAME /recycling.periodicRestart.privateMemory:6710886 |
This will recycle the application pool when it reaches the 6.4Gb (value expressed in Kb).
When we couple this approach with our application warmup strategy in the Maximum IIS application pool availability guide, we can trigger an overlapped recycle that produces a fully warm second copy of our application so the recycle is not felt by our users.
That’s it – you just saved your organization 50% of it’s cloud VM budget. And you did it even before the devs finished testing the memory optimizations.
Be sure to ask for a raise. I suggest starting at 50% of the annual savings and working down 🙂
Conclusion
We saw how a carefully measured approach can result in 50% savings from your cloud budget, before doing any hard work.
However, I still strongly recommend memory optimization. With LeanSentry memory diagnostics, you can make regular optimizations a part of your process to make sure memory leaks don’t creep back up. This way, you can keep your cloud costs low going forward.
To learn more about optimizing your application memory usage, check out our memory tuning guide.