Server power consumption is rapidly becoming a hot topic in the IT industry.
For many data centers, the cost of powering servers has become a top budget item. In fact, in 2008, the average cost of power used by a server exceeded its purchase price (1).
Nationally, the EPA estimated data center electricity consumption to cost over $4.5 Billion a year in 2006, projected to grow to $7.4 Billion in 2011 (2).
The 2007 EPA report to Congress on data center power consumption has spurred an enthusiastic industry response, seeking to understand and reduce server power consumption in the data center.
Yet, industry surveys consistently show that many IT operators are still unaware of how much power their servers are using. The main reasons cited are on the business side – typically, due to lack of communication between the facilities org that pays the power bill, and the IT department that operates the servers.
Fortunately, getting a handle on power use can be done without spending a lot of time or money, or interrupting the normal operation of your data center. A good first step is to understand the power profile of a typical server (and later the supporting IT equipment) in your environment. Once you do that, you may be able to extrapolate the power consumption of the entire farm without explicitly measuring it.
Another benefit of measuring the power at the server level is the ability to see how power use correlates with workload and other operational factors (more on this later). This type of information is usually not available at the rack / PDU level, where much of production power monitoring often takes place.
This is the approach that we have taken over the past 6 months, while working on a power management technology for server farms. In the process, we created a tool to help with monitoring server power usage with the power meter we used (which is provided with this post).
DISCLAIMER: The content below is for illustration purposes only, and provides no guarantees of any kind. It is not intended for a production environment.
Measuring server power consumption
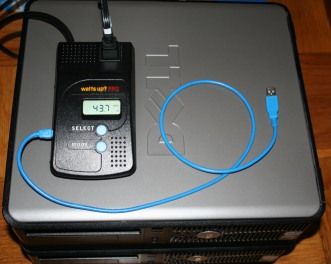
For quick and easy power measurement, we chose Watts Up Pro, a cheap power meter with USB output, which sells online for about $130. There are others you can use as well, but be sure to investigate whether its possible to programatically consume power measurement data if you want to do any kind of serious analysis.

Watts Up Pro power meter
Plug the server into the meter, and you can immediately see the Wattage and a host of related metrics on the LCD screen (pictured above with one of our workstation machines).
Our main point of interest was the server itself – however, to extrapolate the power usage for your DC, you’ll likely want to measure a representative unit of equipment including the server(s) and related UPS/networking equipment. You can plug all of these into a single power strip, and plug that into the meter to capture it all.
Monitoring power consumption
The next step is to be able to monitor the power use over a period of time, and across varying load conditions. You can then use this information to more accurately predict the server power consumption in your environment, and gain insight into to control it by correlating it with many other operational and load factors.
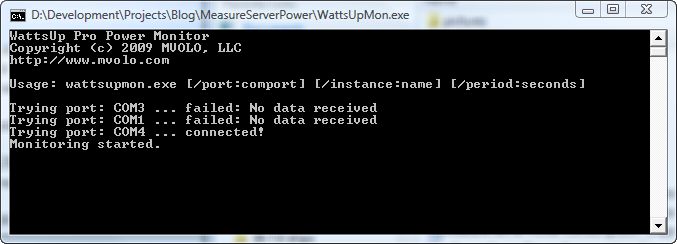
To collect the power data automatically using the Watts Up Pro meter, we wrote WattsUpMon.exe.
This tool captures the power samples in real-time from the meter’s USB interface, and publishes this information using Windows performance counters. Doing so enabled us to monitor the power consumption using any standard performance counter collection tool (including PerfMon.exe), as well as correlate the data programmatically for analysis.

Using WattsUpMon.exe to monitor power data from a Watts Up Pro meter
If you are using the Watts Up Pro meter, download the WattsUpMon.exe tool.
To use:
1. Connect the meter’s USB cable to the monitoring computer
2. Install FTD’s virtual serial port driver: http://www.ftdichip.com/FTDrivers.htm
3. Double-click WattsUpMon.exe (or use the cmdline parameters to customize behavior)
4. Access the performance counters from the WattsUpPro performance object
Analyzing server power consumption
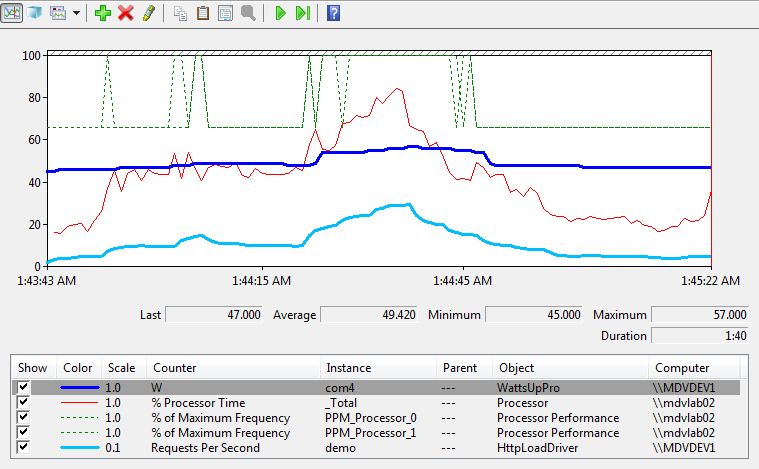
Using the meter and the monitoring tool, we could then monitor the power consumption of a server over time, and observe how it changes depending on the load. Below is a PerfMon graph of power consumption for a DELL Optiplex 330 workstation machine, while running an example load scenario:

Analyzing power consumption patterns using PerfMon.exe
The machine is part of the new generation of power efficient hardware, and it shows with the average power consumption of 49 watts during the test. This is impressive, compared to several much slower machines in our lab that draw 200+ watts.
An important thing to note that is that the power consumption of the server changes by as much as 20% of the maximum power consumption during the test run (45-57 watts). This is due to the automatic power management, enabled by default in Windows Server 2008.
The default “Balanced” power policy uses demand-based switching (DBS) to automatically reduce the frequency of the processors to save power when the machine is under low load. This leverages the P-state toggling support provided by the processors to the Windows ACPI layer. You can see this in action from the dashed green lines representing the % of maximum processor frequency: when the CPU utilization is low, the CPUs are working at roughly 66% of the maximum frequency. When the utilization increases, the processor frequency is increased, and the power demand follows.
Obviously, the processor is not the only power user in the server (although a major one). Other key consumers include the internal disk drivers, and attached network devices e.g. NAS. By correlating performance characteristics of the server and associated equipment for specific workloads together with power consumption, it is possible to more accurately model not only the overall power consumption – but also the power cost and power efficiency of specific workloads. This can then help make better decisions at both the data center and application level to achieve optimal power efficiency, using intelligent workload allocation and techniques like resource consumption shaping (5).
The cost of power
Extrapolating from this scenario, our workstation might costs us 49 Watts / 1000 (KWH) * 24 hrs * 365 days * $.15 = $64/year (using average 15c/KWH commercial price for Middle Atlantic region in Sept 2008 (3)).
In a data center setting, we would use the average Power Usage Effectiveness (PUE) ratio of 2.5 to determine the real power consumption due to the server’s operation (4).
This essentially means that the typical data center will consume 2.5 watts for each 1 watt consumed by a server in cooling, and power distribution overhead. So, you might project that operating this server costs you $160/year in power costs.
The DELL Optiplex 330 is a new power-efficient workstation machine. Let’s say you had a more typical server that consumed 200 watts on average, and you had a 1000 of them. Then, they might run you about $653,000/year. If you had 2000 of them, your cost would be $1.3M/year.
In our case, Windows Power Management saves us about 14% of power consumed. This is a great start, and it’s to know that everyone using Windows Server 2008 will experience similar savings by default (you can also turn this on Windows Server 2003). Windows 7 promises to deliver even more savings.
The even better news is that it is possible to do much better that that.
The technology that we are developing may be able to deliver much more considerable power savings for server environments. Our goal is to reach anywhere from 30-80% depending on the environment and load patterns, while insuring quality of service and availability of the server environment.
We hope to realize very significant cost savings for data centers, without requiring expensive investments in new hardware, and application software changes – and provide added savings to those that are also looking to deploy server virtualization and more efficient server hardware to cut power costs. This should help reduce the pressure of increasing energy prices, demand, and a growing imperative to reduce carbon footprint of DC environments.
More on this in the upcoming weeks. In the meantime, happy measuring.
(1) Belady, Christian. 2007. “In the Data Center, Power and Cooling Costs More Than the IT Equipment it Supports.” Electronics Cooling. Vol. 23, No. 1, February 2007.
(2) U.S. Environmental Protection Agency. 2007. “EPA Report to Congress on Server and Data Center Energy Efficiency”.
(3) U.S. Energy Information Administration. http://www.eia.doe.gov/cneaf/electricity/epm/table5_6_a.html
(4) The Uptime Institute. 2007. The Green Grid Data Center Power Efficiency Metrics: PUE and DCiE.
(5) James Hamilton’s blog. Resource Consumption Shaping.
For many data centers, the cost of powering servers has become a top budget item. The first step to reducing
Nice read. Can you use the power monitoring tool to monitor power usage remotely?
Yes, definitely.
The beauty of the tool is that it exports the real-time data to Windows performance counters. At this point, you can monitor power usage along with other performance data remotely through tools like PerfMon.exe, or schedule data collectors to analyze it later.
We use our own internal tools to do pretty heavy monitoring and correlation of perf data, but there are a plethora of Microsoft and other tools that work well with performance counters.
Best,
Mike
Good post..
Great Work!! A great app for the Watts Up Meter. Software is professional class. Keep it up
Hi Mike,
This is Very nice utility. Is there a way to start and stop the export on demand, rather then specifying the fixed period!? Also where does the exported log generated?
Basically, I want to export the power usage data during the the running of an App. So start before launching the App and stop once App finishes.
Thanks,
D
([email protected])
Thank you for submitting this cool story – Trackback from NewsPeeps
Enjoyed this post, Mike. I’m trying to find out how much power an average web server consumes for a day and how to transfer that into dollars. I’m writing story on cloud computing from an eco-friendly perspective. Look forward to your response.
Hi
Can you send me the specifications of this instrument
[email protected]
t is possible to more accurately model not only the overall power consumption – but also the power cost and power efficiency of specific workloads. This can then help make better decisions at both the data center and application level to achieve optimal power efficiency, using intelligent workload allocation and techniques like resource consumption shaping
go go ok
I really liked your blog quite informative and interesting
facts and figures you have discussed on your blog even the
comments are very fruitful and helpful in enhancing the
knowledge regarding the topic.
You can use this information to more accurately predict the server power consumption in your environment, and gain insight into to control it by correlating it with many other operational and load factors
This site is really useful for me…..Its really informative and nice..I really like this.
server racks
I was having same issue on W3K 64bit (VPS toulsion). When I installed MailEnable (free edition) it auto installed the 64bit version (initially ME complained that I didn’t have DotNet 3.5 installed so I installed that 1st then retried ME install which worked).ME WebMail worked just fine. But then I needed to install some 32bit ActiveX DLLs for my website (ASPUpload was one of them), and to get these working I had to run c:inetpubadminscriptsadsutil.vbs set w3svc/AppPools/Enable32bitAppOnWin64 1This got my 32bit DLLs working fine but WebMail stopped with an error like %1 not 32bit Win app (or something like that).So I ran your toulsion (C:WindowsMicrosoft.NETFrameworkv2.0.50727aspnet_regiis.exe -i -enable) and hey presto, WebMail worked again *and* my 32bit DLLs kept on working. IIS6 added (and enabled) the entry ASP.NET v2.0.50727 (32 bit) to the Web Service Extensions list. ASP.NET v2.0.5072 was already in the list (I suspect from the DotNet 3.5 install). I think I also ended up with 2 Default.aspx entries in the Document list for all my websites (I just went and deleted one or both Default.aspx entires from all my websites that didn’t use aspx).This took me several days to resolve. I hope my experience (and Alex’s) helps others.Cheers Alex.Regards, Mark. Sydney, Australia.
Thanks for this tool.
Please I wanted to call this tool from inside a custom application to measure some function energy consumption then stop the measurement.
The measurements need to be inside a loop.
I could not see the log file; I only get WattsUpMon.pdb not sure if this is the output log file.
Your reply is highly appreciated.
Thanks.