Fixing memory leaks is more important
(and easier) than you think.
I talked about w3wp.exe CPU usage a lot in the last few months, but there is another thing that can have even more impact on your performance and costs.
The memory usage of your w3wp.exe.
(For the step-by-step, jump straight to our new hands-on guide for fixing w3wp memory leaks.)
Traditionally, the high memory usage of your IIS worker process was something that was accepted as “the way it is”.
The main reason for this, even more so than many other production issues that LeanSentry diagnoses, is that diagnosing memory leaks in production has historically been too hard:
- The tools that developers use to analyze memory usage, like the CLR Profiler or the ANTs profiler (which track .NET object allocations), are not viable in production. Their overhead would bring a typical web server to a crawl.
- Combine that with the fact that memory leaks often only happen under real load, and therefore require getting the analysis timing right, and you can pretty much kiss memory analysis goodbye.
The costs of high memory usage in production
As a result of ignoring memory usage, most websites have to accept the memory footprint of their IIS worker processes.
(This footprint also often grows over time, due to the accumulation of memory leaks added by new features.)
This burden directly leads to:
- Large increase in cloud/server costs. Unlike CPU bandwidth, which can be horizontally scaled in/out as needed, memory allocation is usually static and results in over-provisioning across the entire deployment.
- Severe garbage collection overhead. The overhead of cleaning up the “leaky” memory allocations, which can often severely reduce application performance under load.
- Excessive recycling can be an expensive bandaid. Without the proper recourse, many websites have memory-based recycling as a bandaid for memory leaks. This can cause additional overhead due to cold start penalties.
Why do cloud costs increase 2x+ due to memory usage?
This happens because while you can HORIZONTALLY scale your web farm to more instances in response to higher traffic load, the memory usage is VERTICAL and is normally fixed for the entire farm. So, once you go from an 8Gb Standard_D2_v4 in Azure, to the next size up 16Gb Standard_D4_v4, the cost of each VM in your farm just went up from $.209/hr to $.418/hr.You can read more about the vertical cost problem in my prior blog post on saving hosting costs with memory management.

Garbage collection is a way bigger problem
(Than most people realize.)
First, Garbage collection overhead often saps a significant chunk of your total CPU bandwidth, especially under load. We routinely see 50% or more of the processor time being wasted in Garbage collection.
(High GC overhead is usually due to a few regressive memory allocation patterns, like midlife crisis where short-lived objects remain referenced long enough to make it to the gen2 heap.)
This hurts performance, and further increases your server costs due to the extra scaling it requires.
Secondly, and perhaps more importantly, high Garbage collection overhead dramatically increases the chances of performance stuttering (due to thread suspension) and hangs.
Yes, that’s right: garbage collection CAN cause hangs, because if GC overhead is high, your thread pool has a much higher risk of hitting thread pool exhaustion (because the thread pool does not create new threads when GC is active).

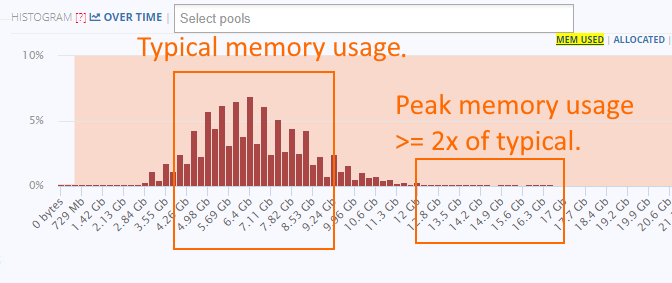
You can and SHOULD tune your memory usage
You can use LeanSentry Memory diagnostics to fix memory leaks, and tune your peak/baseline memory usage.
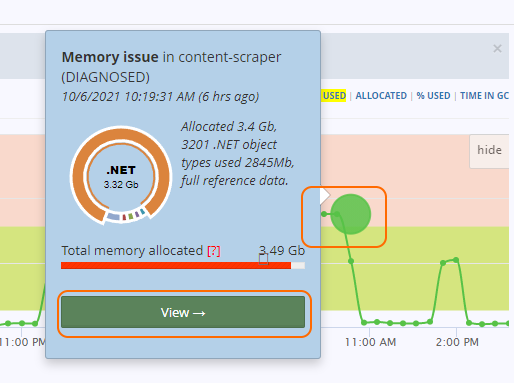
Because LeanSentry automatically tracks memory usage, and GC overhead, and can attach to your process to perform short-duration diagnostics, production diagnostics are now well within reach.

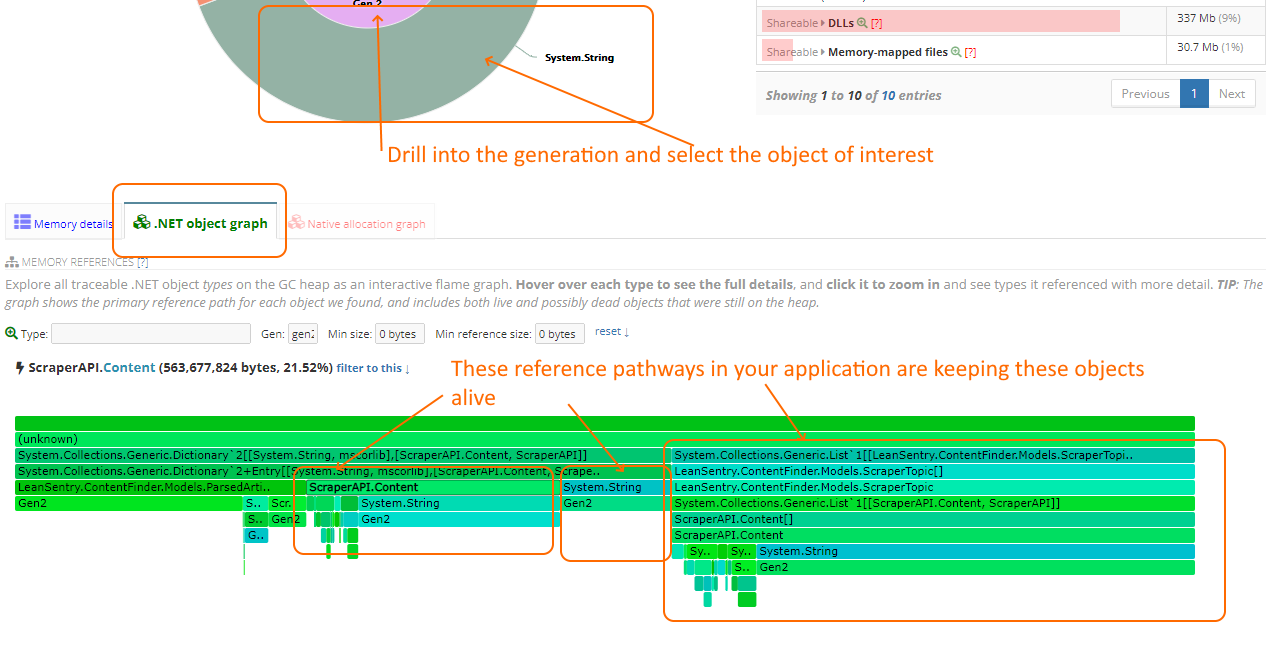
Then, your team can use the memory diagnostic reports to directly track down the leaks to specific objects and specific application code.

Tuning memory usage with LeanSentry Memory diagnostics directly helps you to:
- Reduce cloud hosting costs, by enabling you to step down to smaller VM instances.
- Improve performance and reduce hangs, by reducing Garbage collection overhead.
- Stop having to recycle during peak load.
If you haven’t done this yet, I strongly recommend to do it because the first 1-2 wins are usually super low hanging fruit. When you run the diagnostic and see what’s causing your high memory usage, you’ll likely feel terrible you haven’t done this sooner …
And then often fix it with a single line code.
(Please don’t blame the messenger!)
To see how you can reduce your w3wp memory usage, head over to our new Diagnose w3wp.exe memory usage guide.