Two months ago, we released an expert guide on high CPU in the IIS worker process.
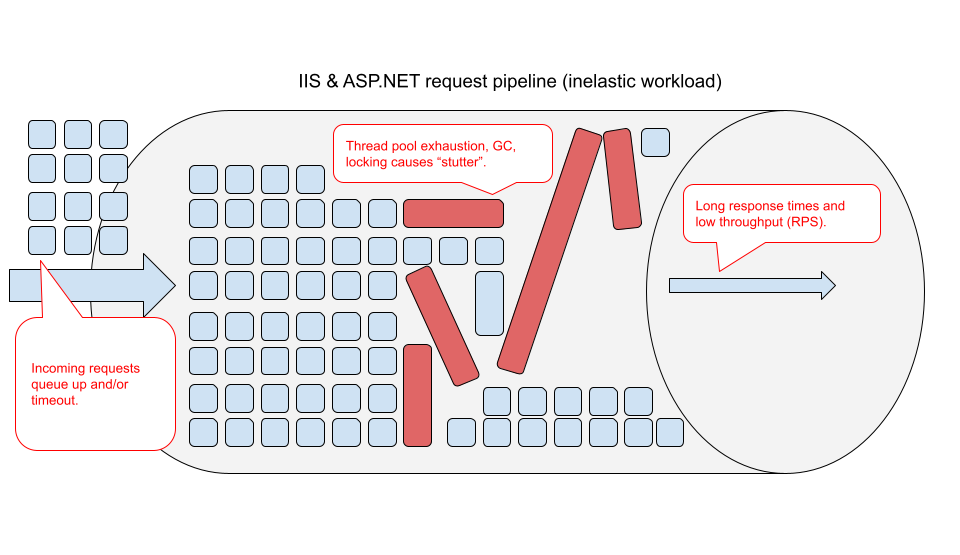
This guide went into great detail on how high or even moderate CPU usage in w3wp.exe can spell poor performance for IIS websites, even if the server processor is not completely overloaded.
(To put it simply, many .NET applications experience a slew of bottlenecks under high CPU usage, which sap their processing power and can cause stutter or even complete hangs.)
This has another consequence for large web applications … you may only be getting 20% or less of the CPU bandwidth you are paying your cloud or hosting provider for.
Think of having to buy 10 movie tickets just to go to the movies with a friend, and sitting next to 8 empty seats you paid for.

Where does all the wasted CPU bandwidth go?
There are two major causes for all this waste.
First, if your application has inelastic performance (has high CPU hangs when the CPU usage goes to moderate or high), you may be forced to keep your CPU utilization at 50% or lower even at peak load.
This means that you are automatically only getting 50% of the CPU instance hours you are paying for.

Second, out of the actual CPU usage of your IIS worker process (w3wp.exe), only a fraction could be “useful” work. The rest could be overhead from inefficient code or wasteful system activity.
(Based on the data we see with LeanSentry CPU diagnostics, these overheads are VERY real and can often become the dominant part of your application’s processor usage.)
They typically include:
- Garbage collection overhead. We see applications that spend 40, 60, and even 90% of their processor time “cleaning” .NET objects, often to no useful effect. We like to see this reduced to <10% using LeanSentry Memory diagnostics.
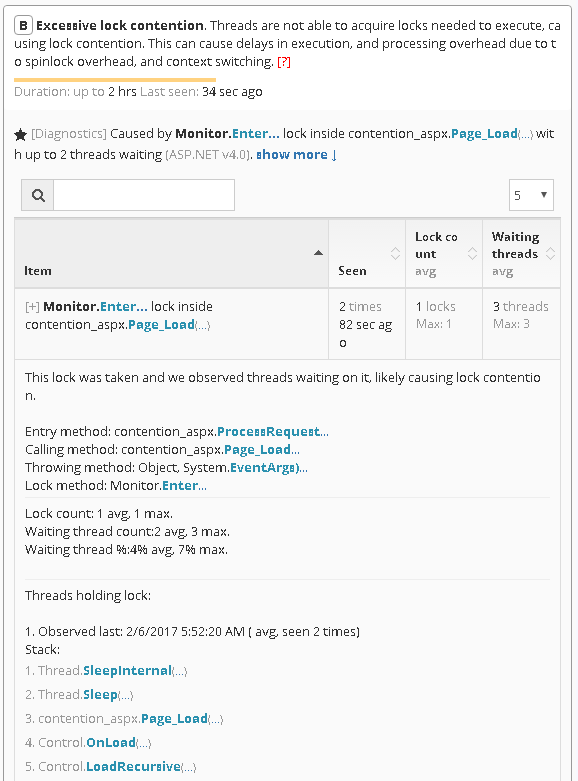
- Lock contention overhead. Also very common, due to locking on a shared codepath, which can cause 10s and even 100s of threads under load to “spin” the CPU while trying to obtain the lock. The resulting high CPU can often make the lock-holding thread slower to release the lock, thereby resulting in a workload that’s 99% spin-waiting.
- Context switching. The overhead created by many active threads in the system, where the processor spends a lot of it’s time switching contexts instead of finishing work.
- Timeouts/wasted processing. Probably the most upsetting, when your application spends time processing requests under load that are taking too long to respond, effectively perpetuating the overload without any useful value created.
Getting your money’s worth
So what can you do to make sure you are getting your money’s worth, or better yet, to drastically reduce your cloud costs?
If you have LeanSentry, you are uniquely positioned to do this (and to be honest, LeanSentry does the hard work for you so it’s pretty easy).
Here is what you do:
- If your application stutters under high CPU usage, use either Hang diagnostics or CPU diagnostics to optimize the code causing high CPU usage during those incidents.
- Use opportunities detected by LeanSentry to reduce the overheads.
LeanSentry will automatically detect sub-optimal overheads and occasionally diagnose them to identify the code that should be optimized. This includes lock contention, context switching, high exception rates, etc. For Garbage collection, you can use the Memory diagnostic feature to optimize it.

For the details on these overheads and how to fix them effectively with LeanSentry, see our High w3wp.exe CPU usage guide.