When you are working with the web server, dealing with errors is a fact of life. They creep in when applications change, when you deploy to a new server, make configuration changes, or add new functionality.
The IIS 7.0 philosophy with respect to errors is that an error is better than something seemingly working in a way that you don’t expect. This helps you maintain control over the behavior of your applications, and helps to discover and address any unexpected issues. This is why I don’t mind errors – they help me eliminate incorrect assumptions and systematically insure that things are working in the correct way.
IIS 7.0 makes easier to diagnose web server errors, primarily through an enhanced detailed error pages, and excellent tracing support for detailed diagnostics. You can find the basic IIS 7.0 troubleshooting techniques in my previous post, Troubleshoot IIS7 errors like a pro.
Most of the time, detailed error pages are enough to diagnose most error conditions. However, sometimes they are not. This happens if the error is indirectly caused by module interactions in the pipeline, and the error page does not reveal the exact cause. Another reason is when the error is occurring in an AJAX callback or an image/CSS request, and you don’t see the detailed error – or, if you are just not sure which url is encountering the error.
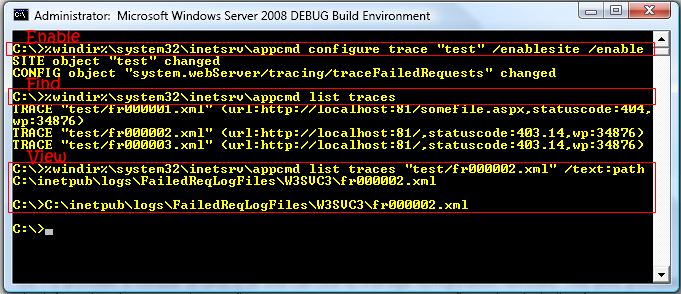
In these circumstances, I break out the trusty Failed Request Tracing. My favorite way of doing this is through the command line, using AppCmd:

Failed Request Tracing: from setting it up to diagnosing in 3 easy steps
1) Open a command line window with the “Run As Administrator” option. To fly through this with the use of quick cut/paste, make sure that “QuickEdit mode” is enabled for the command line window.
2) %windir%system32inetsrvappcmd configure trace "<site/url>" /enablesite /enable
This enables failed request tracing for the site, and also generates default tracing rules for the url (more on this later). You can also enable from InetMgr but I can do it faster here.
3) Make the request(s) that causes an error
4) %windir%system32inetsrvappcmd list traces
This shows the list of trace files, including the urls, and status codes. Highlight the trace id of the one you want and right click to copy it. You’ll paste it below to view it.
5) %windir%system32inetsrvappcmd list trace "traceid" /text:path
This will display the path to the trace XML file. Highlight the path, and right click to copy it.
6) Right click to paste the path to the XML file, and press enter. This will typically pop up the XML file in your browser, causing it to be displayed using the provided Failed Request Tracing stylesheet for quick analysis.
There are two important parts to this.
First, the appcmd configure trace command is used to enable Failed Request Tracing for the site, AND generate a default trace configuration for the url. Here is that default trace configuration:
<tracing>
<traceFailedRequests>
<add path="*">
<traceAreas>
<add provider="WWW Server" areas="Authentication,Security,Filter,StaticFile,CGI,Compression,Cache,RequestNotifications,Module" verbosity="Verbose" />
<add provider="ASP" areas="" verbosity="Verbose" />
<add provider="ISAPI Extension" areas="" verbosity="Verbose" />
<add provider="ASPNET" areas="Infrastructure,Module,Page,AppServices" verbosity="Verbose" />
</traceAreas>
<failureDefinitions timeTaken="00:01:00" statusCodes="500,400,401,403" verbosity="Warning" />
</add>
</traceFailedRequests>
</tracing>
Translation: Trace requests to all extensions for this url or any url below, that result in responses with status codes of 400,400,401, and 403, OR take more than a minute to execute, OR generate events with verbosity of Warning or above. That last clause pretty much captures any requests that set an error response code. The trace automatically includes events from all configured providers/areas at the highest verbosity level for maximum diagnostic fun.
A common task is to include non-error response codes just to see what is going on with the requests. To do that, include the /statuscodes parameter to appcmd configure trace and set it to a list of status codes you want traces, such as 200.
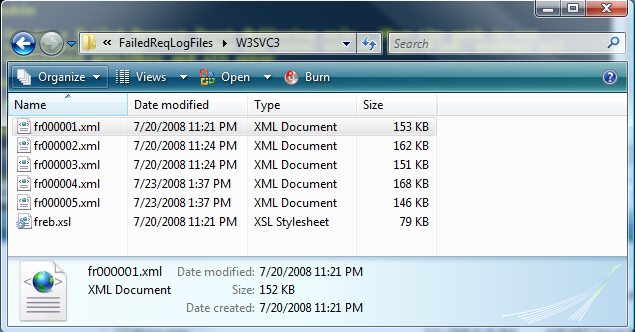
Second, the appcmd list trace command is used to find the trace logs you want. If you have a bunch of these, finding it through Explorer is a pain, because there is no way to tell which XML file corresponds to which url/error, so you have to open each one. With the appcmd list trace command, you can quickly examine the urls / status codes of the logs, and pick the one you want.

Failed Request Tracing log files in Explorer: Which one do I want?
You can actually use the appcmd list trace command to search for the exact log you want, filtering by the url prefix, status code, time taken, site name, application pool name, worker process id, and more. Describing how to do all of these will make for a very long post, so here is an example:
%windir%system32inetsrvappcmd list traces /url:http://localhost/myapp /verb:get /timetaken:$>200
This will show all trace logs for all GET requests to urls under http://localhost/myapp that took more than 200 ms to execute.
For more info on configuring Failed Request Tracing with appcmd, look in the tool help for the appcmd configure trace and appcmd list trace commands.
Happy troubleshooting!
Mike
When dealing with hard to find IIS 7.0 errors, I break out the trusty Failed Request Tracing. My favorite
Interesting post. Thanks!
An very interesting post from Mike on IIS 7.0 Tracing. Read the full post here .
When dealing with hard to find IIS 7.0 errors, I break out the trusty Failed Request Tracing. My favorite
Really short but useful howto.5 stars for good writing.
Thanks.
Thank you for submitting this cool story – Trackback from NewsPeeps
Sir,I have a problem regarding IIS 7.5 on WIN7. I enter the following three command, seach on a single line in CMD, pressing return at the end of each line.
1.cd %systemroot%system32inetsrv
2.AppCmd set config “Default Web Site/” -section:system.webServer/security/requestFiltering -requestLimits.maxAllowedContentLength:4294967295 -commit:apphost
3.AppCmd set config “Default Web Site/” -section:system.webServer/handlers -[name=’CGI-exe’].responseBufferLimit:0 -commit:apphost
I encounter a error when I run third command:error(message:can’t find the requested aggregation of elements )why?pls tell me how can I do next?([email protected])
It would be helpful if you could discuss how to get XML files to open in the browser. I get “The XML page cannot be displayed” “Cannot view XML input using XSL style sheet. Please correct the error and then click the Refresh button, or try again later.” “Access is denied. Error processing resource ‘file:///C:/inetpub/logs/FailedReqLogFiles/W3SVC4/freb.xsl’. ”
I bet it is just a security setting, but I can’t seem to find a way to allow opening of files on the C:.
Thanks.
The 4 server logs you NEED to know to fix any IIS / ASP.NET error | Blog-Host Net India
[…] Can’t seem to catch the error? It it gone from the log before you can get to it? Then you need the IIS Failed Request Trace feature. This will let you configure a rule to capture a detailed request trace for a specific URL, status code, or time elapsed. Learn how to set up Failed Request Tracing to capture IIS errors. […]
Hi,
Just switch off IE Enhanced Security Configuration and try opening it again. It should work.
Regards,
Raja.
should you run all the time with tracing enabled? how do you turn it off when you are done using it?