Your users are complaining that the site is loading slowly. Requests to your application are hanging. With so many possible causes of request hangs, its difficult to know where to even start.
I have been helping people with hanging requests for a long time, first at Microsoft, and now at LeanSentry. My first step is always to reproduce and observe the problem. Once you do that, you know what you are dealing with and can formulate an effective plan to fix it.

Check it out over at https://www.leansentry.com/Guide/IIS-AspNet-Hangs.
I see lots of people using the “stab in the dark” method, blindly guessing at things or worse yet making code changes to fix what “they think” it is. This usually just ends up wasting their day/week. And often with little to show for it at the end.
Here is my preferred method for diagnosing hanging requests on IIS servers:
1. Dump hanging requests
Run:
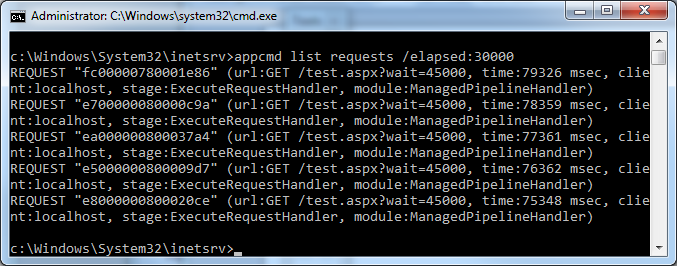
%windir%system32inetsrvappcmd list requests /elapsed:30000 
If the requests are currently hanging, this will instantly show you 3 critical things:
1. Which URLs are involved
2. Whether all requests to the app are hanging or just specific URLs
3. The module/request stage they are hanging in.
2. Next, get a detailed request trace
The request trace for the hanging request will give you more information about where the request is hanging.
Also, Failed Request Tracing can be used to capture the hanging requests if you are unable to catch it in real time. You can use it to set rules that capture traces when requests to specific URLs exceed a time limit, or fail with specific errors, etc.
When we were working on IIS 7.0, Jaro (the developer on Failed Request Tracing) and I often talked about the primary weakness of FRT for troubleshooting: that you had to modify the application configuration in order to configure the tracing rules. If you had a problem and configured trace rules to capture a trace, the resulting configuration change would restart the application and would likely reset whatever problem condition you were trying to trace. I was always a big advocate of allowing server variables to be used to turn on tracing at runtime, so that I could then at least write a module to dynamically enable traces without touching configuration. Unfortunately, this was never done for the FRT feature. This was one of the reasons that we built a custom trace provider for LeanSentry, that is hosted completely outside of the IIS application and cannot affect it.
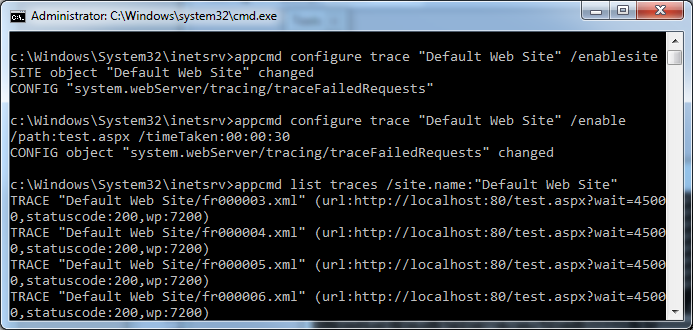
To enable FRT rules, run:
%windir%system32inetsrvappcmd configure trace "Default Web Site" /enablesite %windir%system32inetsrvappcmd configure trace "Default Web Site" /enable /path:test.aspx /timeTaken:00:00:30
Then, after a while, if you were lucky enough to capture the traces, you can find them like this:
appcmd list traces | findstr "test.aspx"When I wrote AppCmd, I added the ability to specify search filters by doing things like /url:$=*test.aspx* for any parameter. This was not a planned feature at the time (many AppCmd features I added werent), so I got quite a bit of pushback from the test team on it. The unfortunate result for this is that the list traces command did not receive this functionality, which makes it harder to quickly search FRT traces using appcmd. Hence the hacky usage of findstr instead.
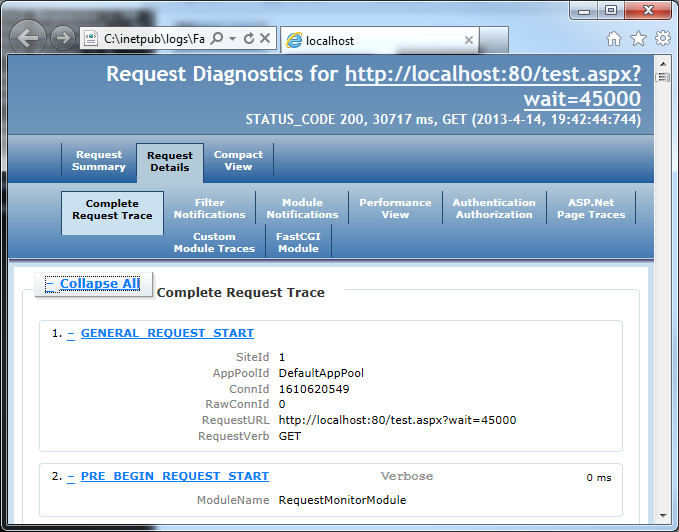
Once you have the trace, you can quickly bring up the trace with this trick:
appcmd list traces "Default Web Site/fr000003.xml" /text:path > temp.bat && temp.bat
Head over to the “Complete request trace” tab to view the events leading up to the hang. Keep in mind that the trace cuts out on the last event before the timeout hit (another unfortunate but easily understandable design decision). This always confuses people expecting to see a big fat “30 seconds spent here!”. The last event should give you an idea of where the hang started.
3. Diagnose it
At this point, you already have a lot of information about what’s happening. You just don’t know why yet. Here are the questions I usually ask:
1. Are all requests to the application hanging or just requests to specific URLs?
If all, I look for typical signs of an overloaded or deadlocked application (resource overload, threadpool starvation, application deadlock). If some, I look for what is causing the request to hang in the application code.
2. Where is the request hanging?
For application-level overload, this usually happens at the beginning of the request processing pipeline (where the request is queued) vs. the ExecuteRequestHandler stage for application code hangs. Differentiating this could sometimes get tricky but it is usually straightforward.
3. Is the request is hung in application code?
You’ll typically see these hanging in the “ExecuteRequestHandler” stage. Then, you’ll need to either be very good at guessing, or break out a debugger to see exactly where the request is stuck.
Guess which approach I usually use 🙂 Of course, debugging in production is an art in itself and is outside of the scope of this post. For the debugger to work, you also need to be able to repro the problem or be lucky to catch it live. We have several techniques we use for rapid debugging, which I’ll blog about in a later post.
Bottom line, hanging or slow requests are a reality for web applications. Its going to happen sooner or later.
The right way to deal with this is to have a continuous monitoring tool in place that catches slow requests whenever they happen, and helps you determine the cause of the hang (obligatory plug: that’s exactly what we built LeanSentry for).
Otherwise you better be ready to spend some time trying to catch the problem, and then roll up your sleeves and bust out some good old troubleshooting techniques.
Mike, thanks. Would you use a profiler to figure out what causes the slowdown in the code?
Hi Dan – unfortunately, a CPU profiler is almost never the right tool for diagnosing slow or hanging requests.
Most of the time, slow requests happen due to either slow db/network IO, or an application deadlock. The profiler will not help you see this because these operations are not CPU intensive (they usually end by placing the thread in a WAIT state, e.g. WaitOnMultipleObjects).
In the rare cases where you have a high CPU hang, CPU intensive code could be the culprit and a CPU profiler could help identify it.
In all other cases, you are better off with a debugger to look at the stacks where the hanging requests are stuck.
Best,
Mike
Cheatsheet: 2013 04.01 ~ 04.16 - gOODiDEA.NET
[…] Troubleshoot hanging requests on IIS in 3 steps […]
Nice! helped catch a request hang today.
Do you plan to blog more about how to figure out application-wide deadlocks? That”s a very interesting topic for us.
Hi Matt,
I”ll definitely blog about this in a later post. There is a lot to cover. We are also adding a diagnostic for this in LeanSentry to automatically figure it out without forcing the user to become an expert in troubleshooting deadlocks.
Best,
Mike
ASP.NET Website Performance Basics – Part 2 « A Place for C Sharpers/.Netters
[…] Hanging Requests — Your users are complaining that the site is loading slowly. Requests to your application are hanging. With so many possible causes of request hangs, its difficult to know where to even start. — http://mvolo.com/troubleshoot-iis-hanging-requests/ […]
Hi Mike,
How you got the output in nice format,i am not getting in the same format.Can you please help
Thank you so much. This helped me find the problem right away.
After reviewing your blog I still can’t decipher where to start troubleshooting the hung issue that is getting this returned in the appcmd dump….any clues?
C:\Users\administrator.FCQA>%windir%\system32\inetsrv\appcmd list requests /elap
sed:10000
REQUEST “f60000008002939f” (url:GET /FCB/LoanForms/Html/test_start_page.aspx, ti
me:18236 msec, client:10.10.22.122, stage:BeginRequest, module:IIS Web Core)
Hi Mark,
Thanks for this blog. I am facing issue that site is getting stuck all of a sudden. There is no fixed action or page. Site is developed with asp.net 4.0 and placed on IIS 7.0.
I also want to know how I can enable the debugger in IIS so I can try to catch the issue why its hanging.
I’m trying to connect to the server using another server but when the request is made it says connected but HTTP request sent, awaiting response… 500 Internal Server Error. How can I correct this?
ASP.NET Website Performance Basics – Part 2 – KP Basics
[…] Hanging Requests — Your users are complaining that the site is loading slowly. Requests to your application are hanging. With so many possible causes of request hangs, its difficult to know where to even start. — http://mvolo.com/troubleshoot-iis-hanging-requests/ […]
I tried running appcmd list requests /elapsed:30000 after navigating to c://windows/system32/inetserv but powershell is telling me “The term ‘appcmd’ is not recognized as the name of a cmdlet, function, script file, or operable program.” even though I can see it right there. I also tried executing it in the command window and there I get no error but I also get nothing back. It just goes straight back to a blank command prompt. What am I missing here?