Performance counters are a wonderful tool when it comes to quickly assessing system health and performance of Windows subsystems. In addition to learning much about the operation of Microsoft products, exposing performance counters from your own code can be extremely valuable for the very same reasons. We do this a lot for LeanServer code – and it saves a lot of time and money when it comes to monitoring, diagnostics, and performance analysis in production.
As with many things, performance counters are only wonderful if they work. Unfortunately, there are many reasons why they might not – most of which has to do with an incorrect implementation or registration of the performance counter provider. When you are developing your own provider, these problems can be difficult to diagnose … and the wealth of random-guess internet posts on the topic can be more misleading than helpful.
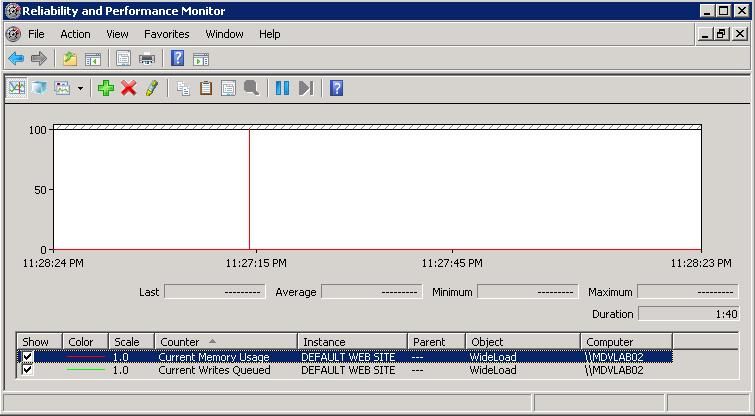
The other day, I ended up having to debug a situation where my counters weren’t showing up in PerfMon. I could see the counter object and associated counters, which meant that the counters were registered (I could also confirm this by inspecting the registry). Whats more, my counter instances were showing up in the counter picker, which meant that my provider was able to start correctly.
Yet, when adding the counters, I got the dreaded “—–“.

After checking the code several times to find nothing wrong, I remembered my own principle – always understand the problem before trying to solve it. Sure enough, armed with this approach and my basic knowledge of the performance counter architecture I had my counters working in less than 5 minutes. I wanted to share this technique in case it may be helpful for others who are debugging counter problems.
Prerequisites:
1) Debugging tools installed. You already have these, don’t you? http://www.microsoft.com/whdc/devtools/debugging/default.mspx.
Background:
PerfMon.exe, like other savvy performance counter consumers, uses the PDH library to read performance counters.
Doing so essentially consists of these function calls:
PdhOpenQuery: creates the performance counter query
PdhAddCounter / PdhAddEnglishCounter: adds a counter to the query
PdhCollectQueryData: collects the raw counter data from the associated providers
PdhGetFormattedCounterValue: retrieves the value for a specific counter
You can look at the return of one or more of these functions to pinpoint the problem. You might need to read the documentation for each to get a good feel for what failures happen where, and look at PDH error codes for more info: http://msdn.microsoft.com/en-us/library/aa373046(VS.85).aspx. Typically PdhCollectQueryData and PdhGetFormattedCounterValue are the ones to focus on.
Steps:
1) Open PerfMon.exe
2) Attach the debugger
Ntsd.exe -pn mmc.exe
(or use ntsd.exe -p PID if you have multiple MMCs open)
3) Get the public symbols (if you don’t already have them somewhere)
In the debugger, enter:
.sympath SRV*c:symbols*http://msdl.microsoft.com/download/symbols
.reload
4) Watch the returns for the function of interest
E.g. when broken in the debugger, set a breakpoint to print the return from the function:
bp pdh!PdhCollectQueryData "gu; r eax; g"
(repeat for other functions if desired)
g
4) Add your counters in PerfMon, and watch the debugger
In my case, I immediately saw the following:
eax=800007d5
eax=00000000
eax=800007d5
eax=00000000
…
PdhCollectQueryData was returning 800007d5 (ignore the 00000000 return, that is PerfMon sucessfully getting its own internal query).
Quick check against the PDH error codes: PDH_NO_DATA. The PdhCollectQueryData documentation indicates that this is an instance problem – the specified instance does not exist.
In my case, I could see the instance in the counter picker, so that led me to inspect the instance name and realize that I was using slashes, which was causing PDH to not be able to find the instance. If this is your problem, look at this article for more info on illegal characters in instance names: http://msdn.microsoft.com/en-us/library/aa373193.aspx.
In other cases, you may see other types of errors such as invalid counter values being provided by your provider, instances missing, etc.
I realize this may be a bit too involved for some, but if you are comfortable with basic debugging, I find this approach can help pinpoint performance counter problems pretty quickly. Of course, you can also write PDH code or code using the .NET performance counter APIs to do some of this debugging, if you already have the needed code available.
If you are writing a performance counter provider for Windows Vista / Windows Server 2008, be sure to check out the PerfLib v2.0 approach for building providers – this saves a lot of time and makes the process significantly easier. More here: http://msdn.microsoft.com/en-us/library/aa965334(VS.85).aspx.
Happy troubleshooting,
Mike
Performance counters are a wonderful tool when it comes to quickly assessing system health and performance
Thank you for submitting this cool story – Trackback from DotNetShoutout
Very cool! I wonder if you need to have private Microsoft symbols?
Hi Brett,
You dont need private symbols – only the public symbols that the debugger will get automatically from the MS symbol server.
This works since we know the PDH functions return HRESULTs, so all we need to do is breakpoint, execute the function, and grab the return from the EAX register.
So, all you need is PerfMon and the debuggers installed.
Thanks,
Mike
Performance counters are a wonderful tool when it comes to quickly assessing system health and performance
.NET Generic Method for Loading Interfaces in C# (For a Plugin System) Which came first, the View or
.NETGenericMethodforLoadingInterfacesinC#(ForaPluginSystem)Whichcamefirst,the…
Thank you for submitting this cool story – Trackback from NewsPeeps
Someone referenced this post to answer question “Where can I see in my windows vista ”Perfomance monitor”?”…
I have found that it remains valuable information in this post. It is really good for us.
This topic, we rarely have meaningful requirements. Even if we do, the only measure of success that matters is whether our solution solves the customer’s shifting idea . Good judgment comes from experience, and experience comes from bad judgment.
From experience it is good.
Cheers pal. I do appreciate the wirtnig.